
サンプルサイズ計算例01
Baxter Nephrology Research
腎臓病に関するリサーチ
タイトル:"Flush before fill" in children receiving automated peritoneal dialysis"
目的:自動腹膜透析(APD)を受けている小児の腹膜炎の発生頻度に対する「flush before fill」(注入前に1度洗浄する)方法の影響を評価する。
デザイン:無作為化プロスペクティブ多施設研究。
患者:腹膜透析を2カ月以上受けており、現在APDを受けている21歳未満の小児患者121名を、「Flush before fill」オプションの使用(Flush/洗浄あり群)または不使用(No Flush/洗浄なし群)に無作為に割り付け、66人の患者が12カ月以上の追跡調査を受けた。
セッティング:Pediatric Peritoneal Dialysis Study Consortium(小児腹膜透析研究コンソーシアム)の参加小児透析プログラム。
https://journals.sagepub.com/doi/abs/10.1177/089686080302300516
1. Warady BA, Ellis EN, Fivush BA, et al. “Flush before Fill” in Children Receiving Automated Peritoneal Dialysis. Peritoneal Dialysis International. 2003;23(5):493-498. doi:10.1177/089686080302300516
臨床試験で用いられた統計に関する情報
"Calculation of the required sample size was based on the assumption that the introduction of the flush-before-fill technique would reduce the peritonitis rate from a baseline study value of 1 infection every 12 patient months to 1 infection every 24 patient months. With a two-sided test, an alpha level of 0.05, and a power of 80%, the analysis required 48 patients per group and 566 patient months per group."
サンプルサイズ計算に必要なパラメーターの要約
| Parameter | パラメーター | Value | 値 |
| Significance Level (Two-Sided) | 両側有意水準 | 0.05 |
|---|---|
| Expected Placebo Rate | 予想されるプラセボ | 1 |
| Expected Treatment Mean | 予想される療法の平均値 | 0.5 |
| Power (%) | 検出力 (%) | 80% |
Step1: 分析方法を選ぶ
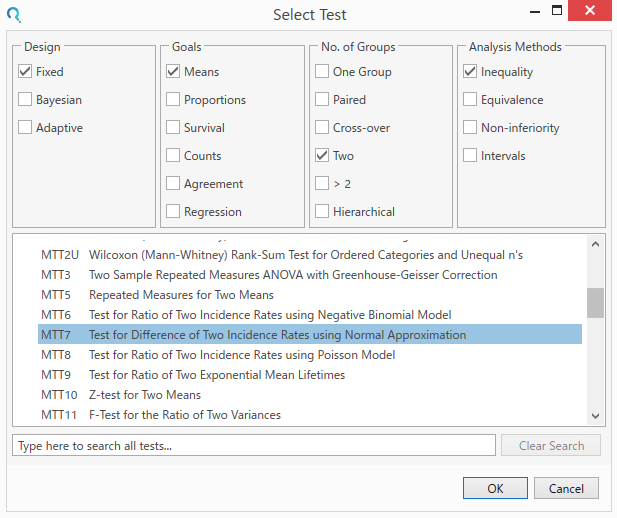
Homeウィンドウで Create a New Table をクリックすると、Select Testダイアログが開きます。Select Testダイアログから、MTT7: Test for Difference of Two Group Test of Two Incidence Rates using Normal Approximation (正規近似を用いた2群における罹患率の差の検定)を選択します。
Note:
直接選択する方法の他に、Design、Goal、No. of Groups、Analysis Methodを選択し分析手法を選ぶ方法、ダイアログ下方にある検索バーにキーワードを入力する方法もあります。
Step2: データの入力
研究のプロトコルに従いサンプルサイズ計算に必要な値を入力します。必要なパラメーターが入力されると、サンプルサイズが自動で計算されます。
算出されたサンプルサイズは各群48、また検出力は80.7%と計算されました。

Step3: Outputウィンドウ
計算が終了すると、メインテーブルの下のOutputウィンドウには結果が文章で要約されます。
1群あたり48人年のサンプルを用いた完全無作為化試験において、2つの罹患率を人年に換算して2面比較した場合、0.05の有意水準で80.74%の検出力が得られ、対照群の罹患率が1であれば、少なくとも0.5の罹患率の差を検出することができます。
Note:
Outputウィンドウを表示するには、Outputタブをクリックします。
